Macroeconomy: Real estate may come under pressure, while infrastructure, consumption and exports stabilize.
There may be some pressure on economic growth in 2020, but the structure matters more than the total. We believe that the biggest downward pressure comes from real estate investment. Real estate investment is likely to begin to decline at an accelerated pace in 2020. Beyond that, we are relatively positive. The cumulative growth rate of infrastructure investment in 2019 is about 4%. We believe that there is still room for improvement in 2020 because counter-cyclical adjustment is imperative. A slight increase of 2-3% over 2019 is entirely possible.
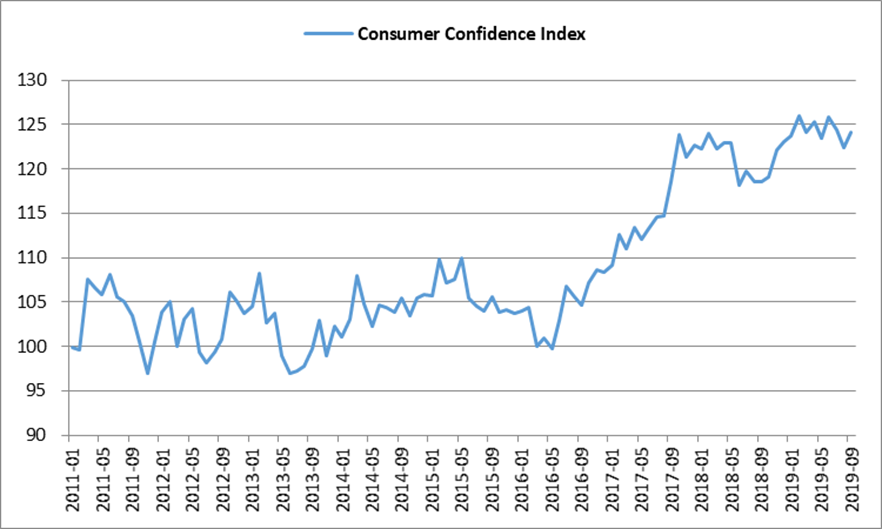
The Consumer Confidence Index started to move up since 2016. Although there was employment pressure in 2018 and 2019, the consumer confidence index had not decreased significantly, indicating that residents' expectations for employment and income were not bad.
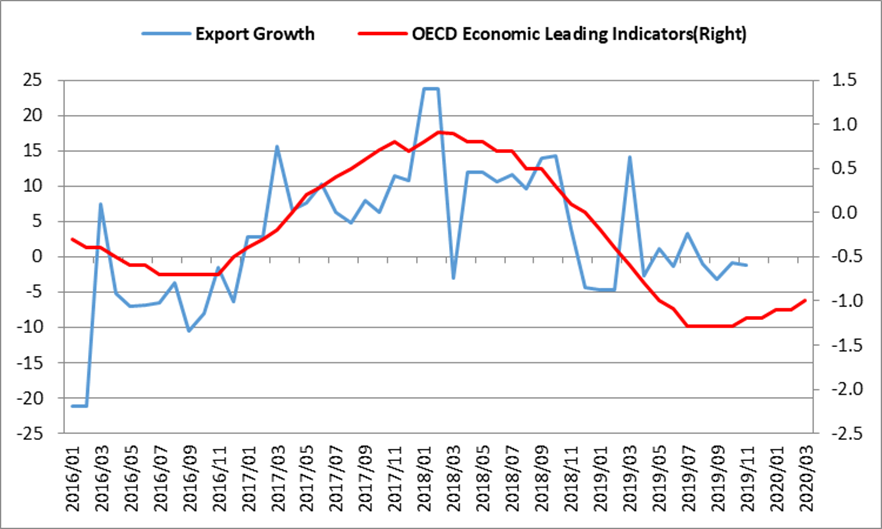
Throughout the economic cycle, export growth has been consistent with overseas demand. Despite of the trade war, there is no serious deviation between the two. With the Phase one Trade Deal signed, there is a very good chance that exports will stabilize in 2020.


Source: Wind
Industry: By 2020, two-thirds of the industry ROE may return to the upward trend.
Based on the third quarter report of 2019, we selected 58 relatively large industries to see which industries' ROE were rising and which were falling, and classified them according to cyclical changes. Calculated by the number of industries, about 50% of the industry ROE was in an upward trend; calculated by market value, it's about 45%. This figure was below 30% at the beginning of 2019. Looking forward, as we are optimistic about infrastructure, consumption and exports, we believe the number of industries with rising ROE will increase. It is estimated that by 2020, the ROE of two-thirds of the industries may return to the rising trend, and the market value of these industries will account for more than 50%.
Liquidity: There is plenty of room for risk appetite to rise.
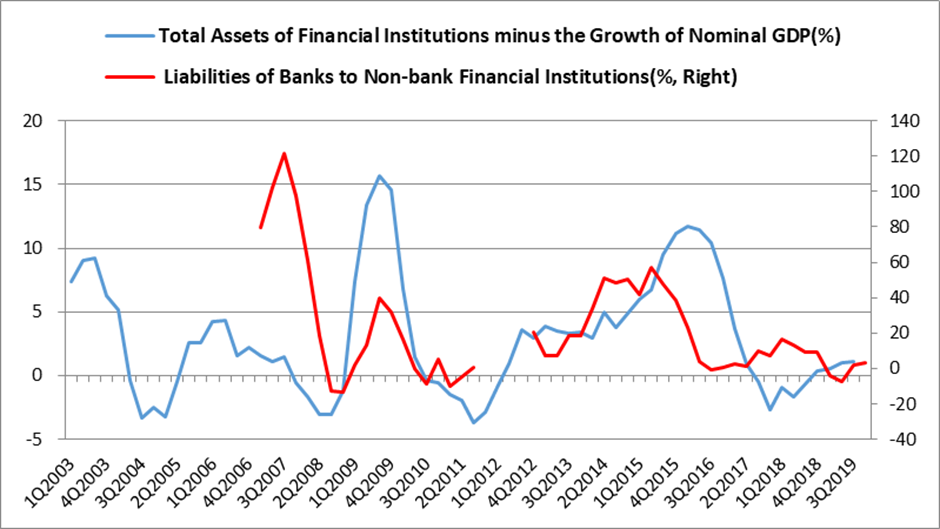
Liquidity is measured by two indicators:
(1) Total assets of financial institutions minus the growth of nominal GDP (red line). Anything greater than 0 indicates relatively abundant liquidity, and anything less than 0 indicates insufficient liquidity. Every time the red line fell below zero, A-shares were invariably bearish (2004, 2008, 2011, 2018). When the red line was greater than 0, there were no bear markets without exception, two-thirds of which were bull markets and one-third of which were volatile markets. The red line is expected to remain positive in 2020. It's not going to become a bear market just because some stocks are overvalued now.
(2) Liabilities of banks to non-bank financial institutions (blue line), mainly including the margin of securities companies. It changes more closely with the volatility of markets and risk appetite. Whenever the blue line was in a rising period, it was a time when savings moved from bank to stock market. Even though the blue line rebounded in 2019, the current risk appetite is still at its lowest level in history, so the blue line is expected to rise in 2020.

Investment direction:
We continue to be bullish on A-shares in 2020, which is still the optimal allocation compared with other assets. In terms of structure: (1) Core assets represent high-quality companies in competitive industries, with stable growth in pricing power and market share. As a market benchmark, they are still excellent assets. (2) Technology, mobile phone, automobile, household appliances industries show clear marginal improvement trend of profitability. (3) The market pricing of banks, real estate, commodities industries includes the expectation of loss or even bankruptcy, but the actual situation is not the case, and there’s room for valuation uplift. (4) The reduction of risk premium in the economy and capital markets brought by the reform will be beneficial to high beta assets such as securities firms, military industry and media.
In the long run, we continue to "fish where the fish are", focusing on four industry-chains that drive China’s economic development and restructuring: advanced manufacturing, TMT, big consumption and health care. By breaking down the boundaries between individual upstream and downstream industries, the Industry-chains Research Model enables us to select superior companies with greater certainty and efficiency.
Disclaimer
The information and data provided in this document is for informational purposes only and is not intended as an offer or solicitation for the purchase or sale of any financial products or services. This document is not intended for distribution to, or usage by, any person or entity in any jurisdiction or country where such distribution or usage are prohibited by local laws/regulations. The contents of this document are based upon sources of information believed to be reliable at the time of publication. Except to the extent required by applicable laws and regulations, there is no express or implied guarantee, warranty or representation to the accuracy or completeness of its contents. Investment returns are not guaranteed as all investments carry some risk. The value of an investment may rise or fall with changes in the market. Past performance is no guarantee of future performance. This statement relates to any claims made regarding past performance of any Rosefinch (or its associated companies’) products. All rights are reserved by Rosefinch Investment Management Corp. and its affiliates.